Blog

  • baota

    Docker 部署宝塔面板

    此方案可能是全网最快的 宝塔面板 部署方案。该镜像基于 宝塔Linux正式版 7.7.0(官方纯净版,可升级) 制作。维护脚本使用 Python 开发,源码和 Dockerfile 均已上传至 GitHub(欢迎您的 Star)。

    本镜像仅保留了最精简的 宝塔面板,未安装任何插件。初始化容器后,您可以根据需要选择安装插件。”Simple is better than complex!” 此外,如果您在生产环境下部署宝塔面板,请务必参考 方案二 创建容器。

    支持系统:Linux,macOS(支持 Apple silicon),Windows

    架构:x86-64,ARM 64

    使用方法如下:

    (注:为了方便部署,该镜像去除了安全入口,您可以自行配置)

    方案一(最快化部署)

    docker run -itd --net=host --restart=always \
    --name baota cyberbolt/baota \
    -port 端口号 -username 用户名 -password 密码
    

    示例如

    docker run -itd --net=host --restart=always \
    --name baota cyberbolt/baota \
    -port 8888 -username cyberbolt -password abc123456
    

    –net=host : 容器和主机使用同一网络

    –restart=always: 守护进程,容器挂掉将自动重启

    -port : 填写宝塔面板运行的端口号

    -username: 填写宝塔面板的用户名

    -password : 填写宝塔面板的密码

    该方法的登录方式:
    
    登陆地址: http://{{服务器的ip地址}}:{{您输入的端口号}}
    
    账号: 您填写的用户名
    
    密码: 您填写的密码


    如果您未自定义用户名和密码,直接使用的如下命令

    docker run -itd --net=host --restart=always \
    --name baota cyberbolt/baota
    

    宝塔面板也会自动创建,此时可通过默认信息登录,默认信息为

    
    登陆地址: http://{{服务器的ip地址}}:8888
    
    账号: cyber
    
    密码: abc12345


    方案二(生产环境部署)

    生产环境中,为了避免极小概率的数据丢失,我们将容器内的宝塔文件映射到宿主机的目录中(您之后安装的 Nginx、MySQL 等服务均会挂载到宿主机目录)。该方法是 Docker 部署宝塔面板的最优方案,可以在生产环境中运行。

    首先按最简方案创建一个测试容器(为保存宝塔文件到宿主机目录中)

    输入命令创建测试容器(这里仅为测试容器,为避免出错,后面几步请原封不动地复制粘贴)

    docker run -itd --net=host \
    --name baota-test cyberbolt/baota \
    -port 26756 -username cyberbolt -password abc123456
    

    将 Docker 容器中的 /www 目录 拷贝至宿主机的 /www

    docker cp baota-test:/www /www
    

    拷贝完成后删除创建的测试容器

    docker stop baota-test && docker rm baota-test
    

    创建宝塔面板容器,并将宿主机目录映射至容器中(自行输入面板的 端口号、用户名 和 密码 后即可完成部署)

    docker run -itd -v /www:/www --net=host --restart=always \
    --name baota cyberbolt/baota \
    -port 端口号 -username 用户名 -password 密码
    

    示例如

    docker run -itd -v /www:/www --net=host --restart=always \
    --name baota cyberbolt/baota \
    -port 8888 -username cyberbolt -password abc123456
    

    –net=host : 容器和主机使用同一网络

    –restart=always: 守护进程,容器挂掉将自动重启

    -port : 填写宝塔面板运行的端口号

    -username: 填写宝塔面板的用户名

    -password : 填写宝塔面板的密码

    该方法的登录方式:
    
    登陆地址: http://{{服务器的ip地址}}:{{您输入的端口号}}
    
    账号: 您填写的用户名
    
    密码: 您填写的密码


    部署成功!

    电光笔记官网 https://www.cyberlight.xyz/

    Visit original content creator repository
    https://github.com/Cyberbolt/baota

  • tpanel

    TPanel

    TPanel is an implementation of some AMX G4/G5 touch panels. The panels used
    to verify the communication protocol and the behavior were an AMX MVP-5200i an
    AMX NXD-700Vi and an MST-701.

    TPanel was designed for *NIX desktops (Linux, BSD, …) as well as Android and
    IOS operating systems. To create an executable for Android a special shell
    script exists. It sets all dependencies and starts cmake with all necessary
    parameters.

    Hint: With version 1.4 of TPanel the support for Qt 5.x was canceled.
    Now you must use Qt 6.x for all operating systems!

    The software uses internally the Skia library for drawing
    all objects and the Qt framework to display the objects
    and handle widgets. TPanel is written in C++. This makes it especially on
    mobile platforms fast and reliable. It has the advantage to not drain the
    battery of any mobile device while running as fast as possible. Compared to
    commercial products the battery lasts up to 10 times longer.

    Full documentation

    Look at the full documentation in this repository. You’ll find the
    reference manual in three different formats:

    How to compile

    Prerequisits

    For Linux and MacOS you need the following libraries installed:

    • Qt 6
    • Skia
    • pjsip
    • openssl (part of your distribution)
    • Expat (part of your distribution)
    • Freetype (part of your distribution)

    To install Qt I recommend to download the open source version from
    Open Source Development.
    However: Some Linux distributions are coming with Qt included. If you want to
    use this version make sure, to install the Qt6 packages.

    Compile for Linux desktop

    First download the source into a
    directory. Then enter the directory and type the following commands.

    $ cmake -B build -DCMAKE_PREFIX_PATH="/<path>/<to>/Qt/6.x.x/gcc_64/lib/cmake"
    $ cd build
    $ make
    $ sudo make install
    

    Replace <path>/<to>/ with the path to your Qt installation (usualy /opt/Qt).

    Compile on MacOSX

    First download the source into a directory. Then enter the directory and type the following commands.

    $ cmake -B build -DCMAKE_PREFIX_PATH="/<path>/<to>/Qt/6.x.x/macos/lib/cmake:/<path>/<to>/homebrew/lib/cmake"
    $ cd build
    $ make
    

    Replace <path>/<to>/ with the path to your Qt installation and to homebrew (usualy $HOME/Qt, /opt/homebrew).

    You’ll find the application in build/tpanel.app/Contents/MacOS/tpanel. Start it from the command line like:

    build/tpanel.app/Contents/MacOS/tpanel -c <configuration file>
    

    If everything compiled successful and installed, you can start the application.
    There is a setup dialog included. It depends on the operating system of how
    it looks like.

    Compile for other operating systems

    Visit original content creator repository
    https://github.com/TheLord45/tpanel

  • Network-analyzer

    Visit original content creator repository
    https://github.com/Binco97/Network-analyzer

  • activity-heatmap

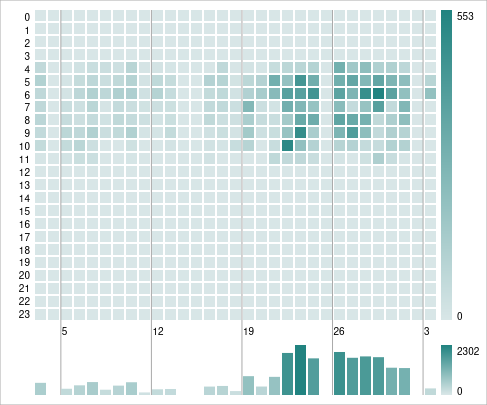
    Activity heatmap

    A(nother) d3.js heatmap representing time series data. Inspired by Github’s contribution chart

    Inspired by the excellent DKirwan’s Calendar Heatmap.

    Reworked for d3.js v5 + ES6 class style.

    Screenshot

    Yearly profile.

    Reusable D3.js Calendar Heatmap chart

    Monthly profile.

    Reusable D3.js Calendar Heatmap chart

    Features & specs

    • Heatmap
    • Histogram
    • Labels and scales
    • Free time granularity
    • Clean coding… (well tell me)
    • Easy to tweak with options and profiles
    • Fully localizable (uses only moment.format())

    Dependencies

    Usage

    1. Add d3.js and moment.js

    2. Include activity-heatmap.js <script src="https://github.com/quazardous/path/to/activity-heatmap.js"></script> or <script src="https://github.com/quazardous/path/to/activity-heatmap.min.js"></script>

    3. Add style stuff for tooltips

    .heatmap-tooltip {
      position: absolute;
      z-index: 9999;
      padding: 5px 9px;
      color: #bbbbbb;
      font-size: 12px;
      background: rgba(0, 0, 0, 0.85);
      border-radius: 3px;
      text-align: center;
    }
    1. Add some container <div id="my-heatmap"></div>

    2. Create the heatmap with some data

      d3.json("url/to/my-data.json").then(function(data) {
        // do your AJAX stuff here
        data.forEach(function(d) {
          // final data items should have at least a JS Date date...
          d.date = new Date(d.timestamp);
          // ...and a Number value.
          d.value = +d.value;
        });
    
        const map = new ActivityHeatmap(data, 'yearly', '#my-heatmap');
        map.render();
      });

    Options

    The second arg is a profile hint that will tweak options. You can override the tweaked options after instantiation.

    The third arg can be an extensive options object.

    const options = {
      selector: '#my-heatmap'
    };
    const map = new ActivityHeatmap(data, 'yearly', options);
    map.options.period.from = new Date('2020-01-01');

    Final computations will be done at render time.

    Here is some common options:

    const options = {
      debug: false,
      selector: "#monthly",
      legend: true,
      histogram: true,
      frame: true,
      colors: {
        separator: "#AAAAAA",
        frame: "#AAAAAA",
        scale: ["#D8E6E7", "#218380"]
      }
    };

    Inline render()

    render() can be use without arguments or you can pass your own SVG object.

    ...
    const heatmap = map.render(mySvg, 100, 50);
    ...

    It returns a SVG group with the whole heatmap.

    Example

    Open examples/ex1.html.

    NB: if you open ex1.html as local file, you may need to bypass CORS (With FF: about:config > privacy.file_unique_origin => false).

    Visit original content creator repository https://github.com/quazardous/activity-heatmap
  • activity-heatmap

    Activity heatmap

    A(nother) d3.js heatmap representing time series data. Inspired by Github’s contribution chart

    Inspired by the excellent DKirwan’s Calendar Heatmap.

    Reworked for d3.js v5 + ES6 class style.

    Screenshot

    Yearly profile.

    Reusable D3.js Calendar Heatmap chart

    Monthly profile.

    Reusable D3.js Calendar Heatmap chart

    Features & specs

    • Heatmap
    • Histogram
    • Labels and scales
    • Free time granularity
    • Clean coding… (well tell me)
    • Easy to tweak with options and profiles
    • Fully localizable (uses only moment.format())

    Dependencies

    Usage

    1. Add d3.js and moment.js

    2. Include activity-heatmap.js
      <script src="https://github.com/quazardous/path/to/activity-heatmap.js"></script> or <script src="https://github.com/quazardous/path/to/activity-heatmap.min.js"></script>

    3. Add style stuff for tooltips

    .heatmap-tooltip {
      position: absolute;
      z-index: 9999;
      padding: 5px 9px;
      color: #bbbbbb;
      font-size: 12px;
      background: rgba(0, 0, 0, 0.85);
      border-radius: 3px;
      text-align: center;
    }
    1. Add some container
      <div id="my-heatmap"></div>

    2. Create the heatmap with some data

      d3.json("url/to/my-data.json").then(function(data) {
        // do your AJAX stuff here
        data.forEach(function(d) {
          // final data items should have at least a JS Date date...
          d.date = new Date(d.timestamp);
          // ...and a Number value.
          d.value = +d.value;
        });
    
        const map = new ActivityHeatmap(data, 'yearly', '#my-heatmap');
        map.render();
      });

    Options

    The second arg is a profile hint that will tweak options. You can override the tweaked options after instantiation.

    The third arg can be an extensive options object.

    const options = {
      selector: '#my-heatmap'
    };
    const map = new ActivityHeatmap(data, 'yearly', options);
    map.options.period.from = new Date('2020-01-01');

    Final computations will be done at render time.

    Here is some common options:

    const options = {
      debug: false,
      selector: "#monthly",
      legend: true,
      histogram: true,
      frame: true,
      colors: {
        separator: "#AAAAAA",
        frame: "#AAAAAA",
        scale: ["#D8E6E7", "#218380"]
      }
    };

    Inline render()

    render() can be use without arguments or you can pass your own SVG object.

    ...
    const heatmap = map.render(mySvg, 100, 50);
    ...

    It returns a SVG group with the whole heatmap.

    Example

    Open examples/ex1.html.

    NB: if you open ex1.html as local file, you may need to bypass CORS (With FF: about:config > privacy.file_unique_origin => false).

    Visit original content creator repository
    https://github.com/quazardous/activity-heatmap

  • typo3_vite

    Typo3 + Vite.js

    This open source project provides a bridge between Vite.js and Typo3 to make development and deployment of modern web applications easier and more efficient. It allows Typo3 users to leverage the power of Vite.js’s fast and modular development experience in their projects. It offers an easy-to-use interface for integrating Vite.js into Typo3 and enables developers to take full advantage of Vite.js’s modern features, such as hot module replacement, tree-shaking, and code splitting. It’s a perfect way to give your Typo3 project the modern web development experience it deserves!

    Setup

    Add a package.json file to your extension or add the following dependencies to your file.

    {
        "name": "extension_name",
        "private": true,
        "version": "0.0.1",
        "scripts": {
            "dev": "vite --host 0.0.0.0",
            "build": "vite build",
            "preview": "vite preview"
        },
        "devDependencies": {
            "vite": "^4.4.11"
        }
    }

    Add a vite.config.js file to your extension. If you don’t use ddev as environment you can remove the https object in the config.

    You are free to change the input and output paths and the alias. If you change the paths, you also need to change your paths in the typoscript configuration.

    import fs from 'fs'
    import path from 'path'
    import { defineConfig } from 'vite'
    
    /** @type {import('vite').UserConfig} */
    const config = {
        server: {
            port: 5173,
            https: {
                key: fs.readFileSync('/etc/ssl/certs/master.key'),
                cert: fs.readFileSync('/etc/ssl/certs/master.crt'),
            }
        },
        base: '',
        publicDir: 'fake_dir_so_nothing_gets_copied',
        build: {
            manifest: true,
            outDir: 'Resources/Public',
            rollupOptions: {
                input: [
                    'Resources/Private/Frontend/main.js',
                ]
            }
        },
        resolve: {
            alias: [
                {
                    find: '@',
                    replacement: path.resolve(__dirname + '/Resources/Private/Frontend/')
                }
            ]
        },
        plugins: [
            {
                name: 'html',
                handleHotUpdate({file, server}) {
                    if (file.endsWith('.html')) {
                        server.ws.send({
                            type: 'full-reload',
                            path: '*'
                        });
                    }
                }
            }
        ]
    }
    
    export default defineConfig(config)

    Extend your TypoScript with your configuration. You can use the template setup in the backend or your setup.typoscript file for that.

    The port need to be the same as in the vite.config.js.

    plugin.tx_typo3vite.settings.extension_name {
        port = 5173
        out = Resources/Public
        src = Resources/Private/Frontend
    }

    Add the viewhelpers in your page template to use your bundled files. The entry is the filename of the input files from the vite.config.js.

    {namespace vite=Crazy252\Typo3Vite\ViewHelpers}
    
    <vite:asset extension="extension_name" entry="main.js" />

    And now it’s done. Start the dev server in your extension folder via yarn dev or other javascript package managers.

    After that, you can view your site with the ?no_cache=1 and you got the full power of vite.js in typo3!

    React setup

    If you want to use react in your frontend, you need to add the following viewhelper in your page template.

    <vite:react extension="extension_name" />

    Extension setup

    If you want to change the domain, url, timeout and other settings you can change it via the typoscript setup. Here are the possible settings with the default values.

    plugin.tx_typo3vite.settings.extension_name {
        out = null                    # path to the output folder
        src = null                    # path to the src folder
    
        domain = https://127.0.0.1    # default domain of vite server
        port = 3000                   # default port of vite server
        uri = /@vite/client           # default uri for vite client
        timeout = 1.0                 # timeout for dev server check
        verify = false                # ssl certificate verification
    }

    DDEV setup

    If you use ddev as environment, you need to extend ddev with a port for the vite dev server. Create a file in the .ddev folder named docker-compose.ports.yaml and add the following content.

    version: '3.6'
    
    services:
      web:
        ports:
          - "127.0.0.1:5173:5173"

    Visit original content creator repository
    https://github.com/crazy252/typo3_vite

  • SCFactual-Explanations-CV

    SCFactual-Explanations-CV

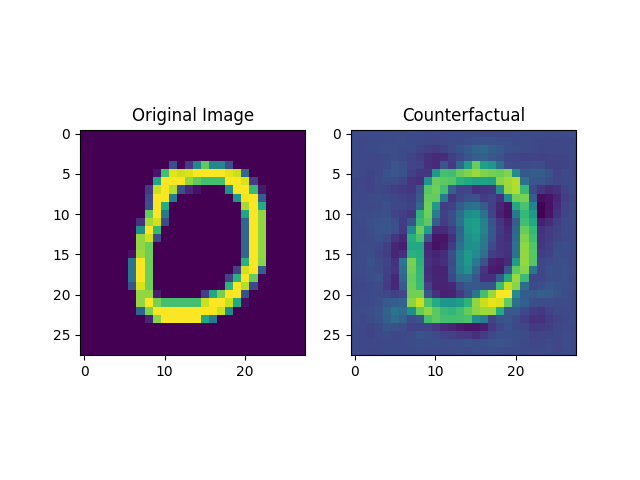
    Creating a pipeline for generating semi-factual and counter-factual explanations for computer vision tasks. A counterfactual explanation describes a causal situation in the form: “If X had not occurred, Y would not have occurred”. Basically generating an image close enough to the original one, which results in a target class.

    AutoEncoder Based Implementation:

    Now as we can see the generated image does not belong to the same distribution as the dataset, therefore constructing a latent vector to be optimized through an AE is used.

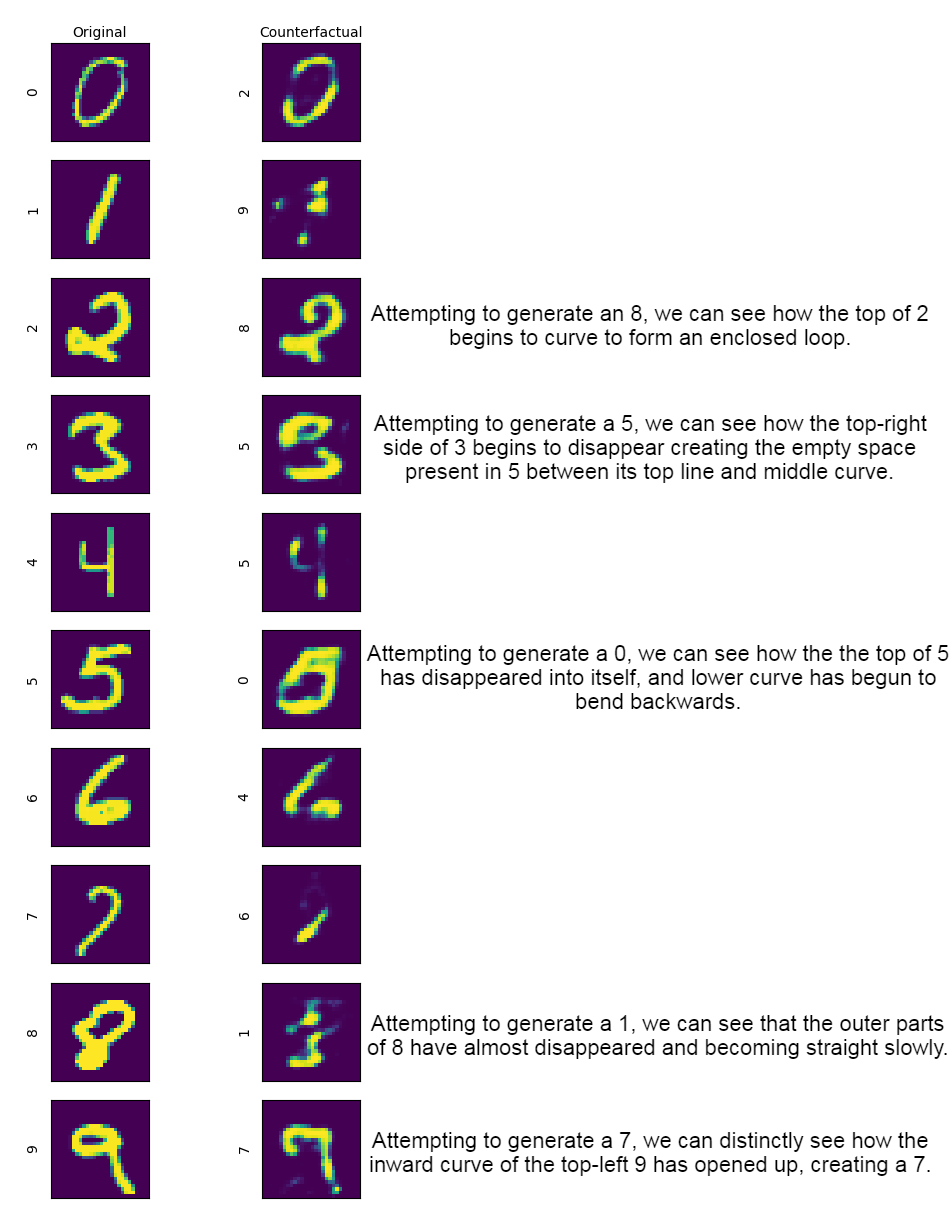
    Results:

    results-ae

    The results below pose interesting observations, discussing a couple of samples:

    • Original=2: Attempting to generate an 8, we can see how the top of 2 begins to curve to form an enclosed loop.
    • Original=3, Attempting to generate a 5, we can see how the top-right side of 3 begins to disappear creating the empty space present in 5 between its top line and middle curve.
    • Original=5, Attempting to generate a 0, we can see how the the top of 5 has disappeared into itself, and lower curve has begun to bend backwards.
    • Original=8, Attempting to generate a 1, we can see that the outer parts of 8 have almost disappeared and becoming straight slowly.
    • Original=9, Attempting to generate a 7, we can distinctly see how the inward curve of the top-left 9 has opened up, creating a 7.

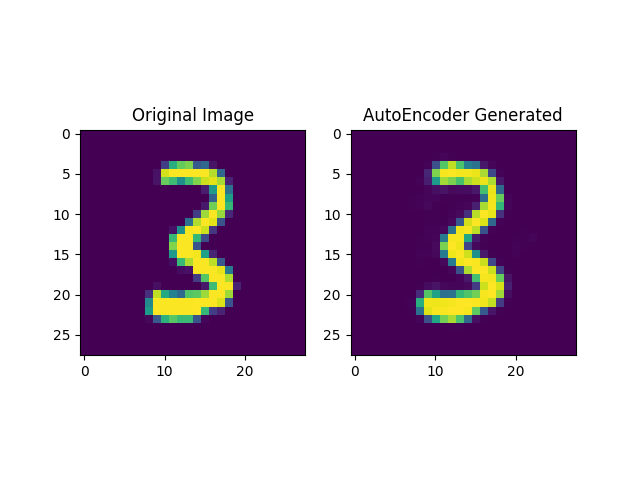
    AutoeEncoder:

    ae

    Inferential Results after more training:

    results-ae

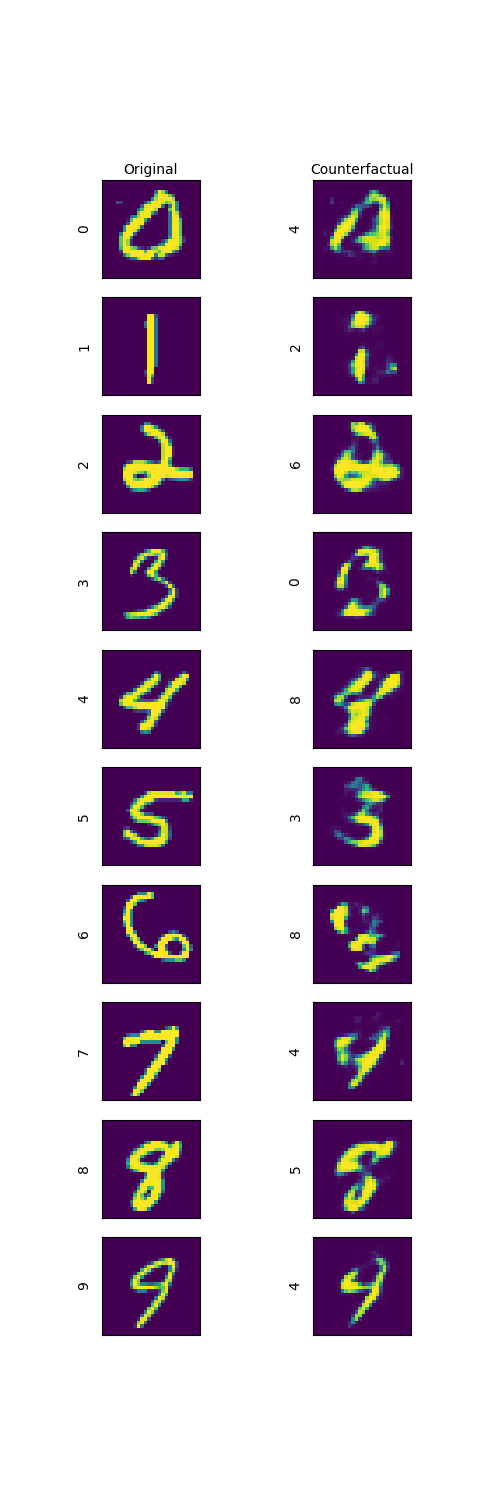
    Basic Implementation:

    Using simple gradient descent we optimize to find CounterFactuals

    counterfactual

    Visit original content creator repository https://github.com/AmanPriyanshu/SCFactual-Explanations-CV
  • IMoS

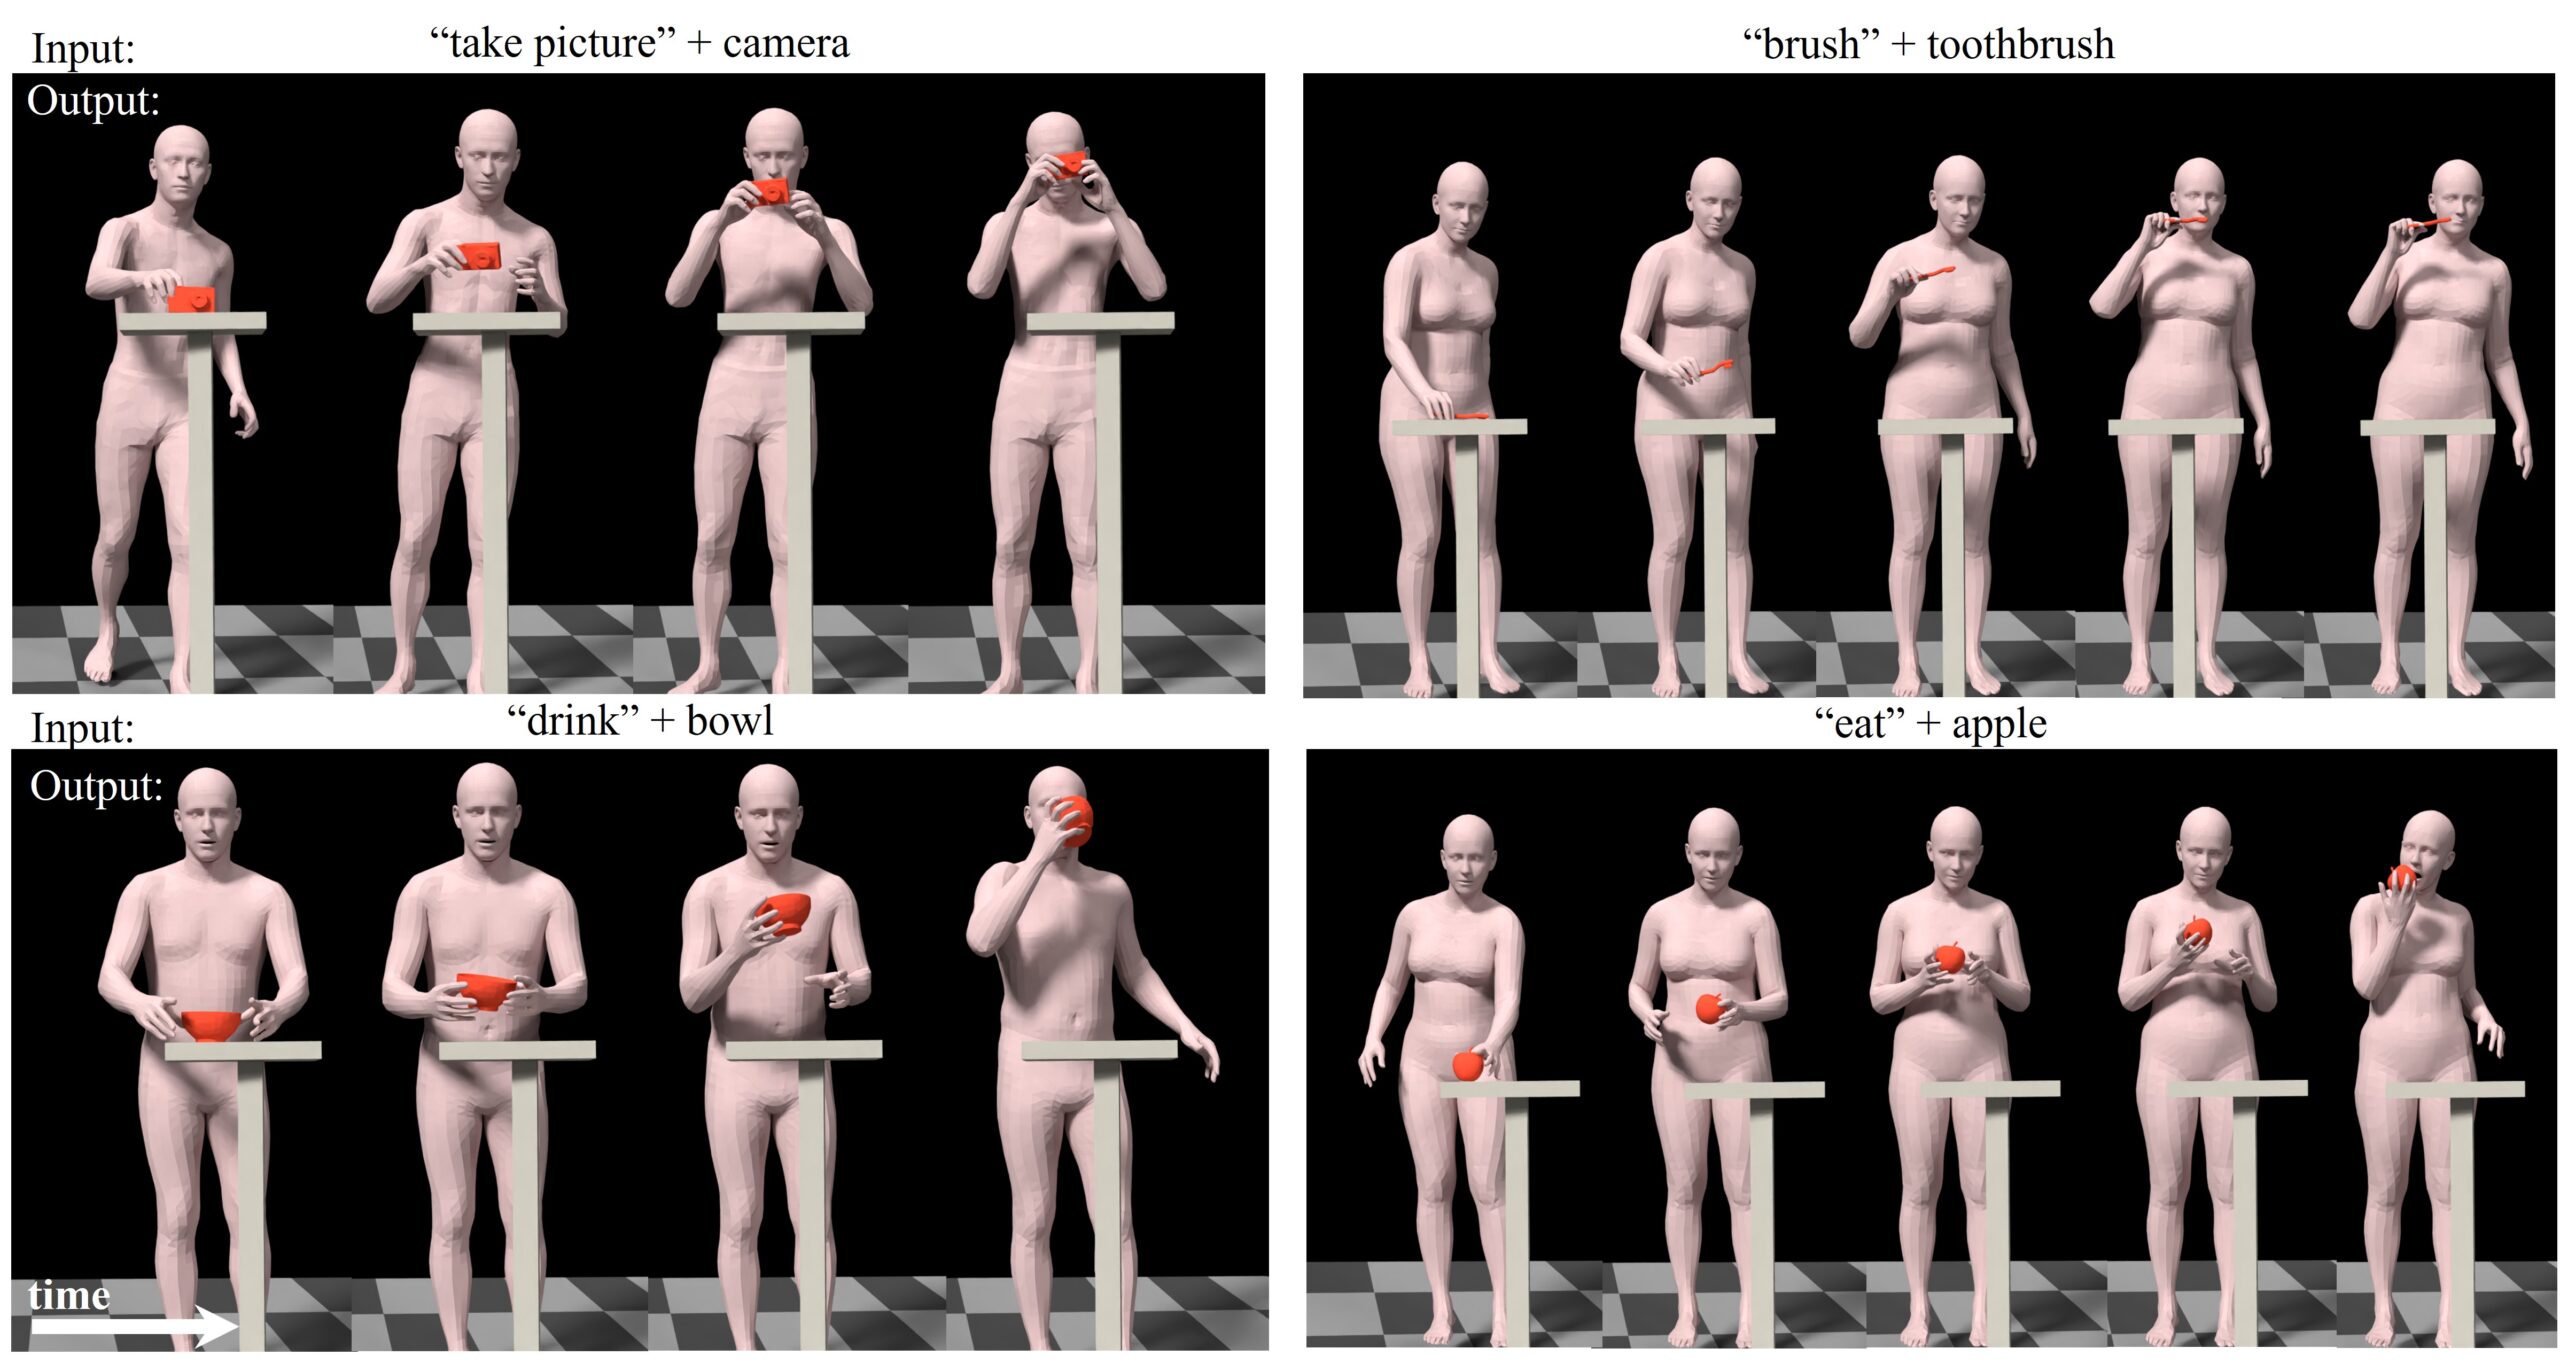
    IMoS: Intent-Driven Full-Body Motion Synthesis for Human-Object Interactions (Eurographics 2023)

    Paper | Video | Project Page

    teaser image

    Pre-requisites

    We have tested our code on the following setups:

    • Ubuntu 20.04 LTS
    • Windows 10, 11
    • Python >= 3.8
    • Pytorch >= 1.11
    • conda >= 4.9.2 (optional but recommended)

    Getting started

    Follow these commands to create a conda environment:

    conda create -n IDMS python=3.8
    conda activate IDMS
    conda install -c pytorch pytorch=1.11 torchvision cudatoolkit=11.3
    pip install -r requirements.txt
    

    For pytorch3D installation refer to https://github.com/facebookresearch/pytorch3d/blob/main/INSTALL.md

    Note: If PyOpenGL installed using requirements.txt causes issues in Ubuntu, then install PyOpenGL using:

    apt-get update
    apt-get install python3-opengl
    
    1. Follow the instructions on the SMPL-X website to download SMPL-X model and keep the downloaded files under the smplx_model folder.

    2. Download the GRAB dataset from the GRAB website, and follow the instructions there to extract the files. Save the raw data in ../DATASETS/GRAB.

    3. To pre-process the GRAB dataset for our setting, run:

    python src/data_loader/dataset_preprocess.py
    

    Download the pretrained weights for the models used in our paper from here and keep it inside save\pretrained_models.

    1. To evaluate our pre-trained model, run:
    python src/evaluate/eval.py
    
    1. To generate the .npy files with the synthesized motions, run:
    python src/test/test_synthesis.py
    
    1. To visualize sample results from our paper, run:
    python src/visualize/render_smplx.py
    
    1. To train our synthesis modules:

      a. To train the Arm Synthesis module, run:

      python src/train/train_arms.py
      

      b. To train the Body Synthesis module, run:

      python src/train/train_body.py
      

    Keep the parameters the same as the pre-trained model argument file.

    License

    This code is distributed under MIT LICENSE.

    Visit original content creator repository https://github.com/anindita127/IMoS